
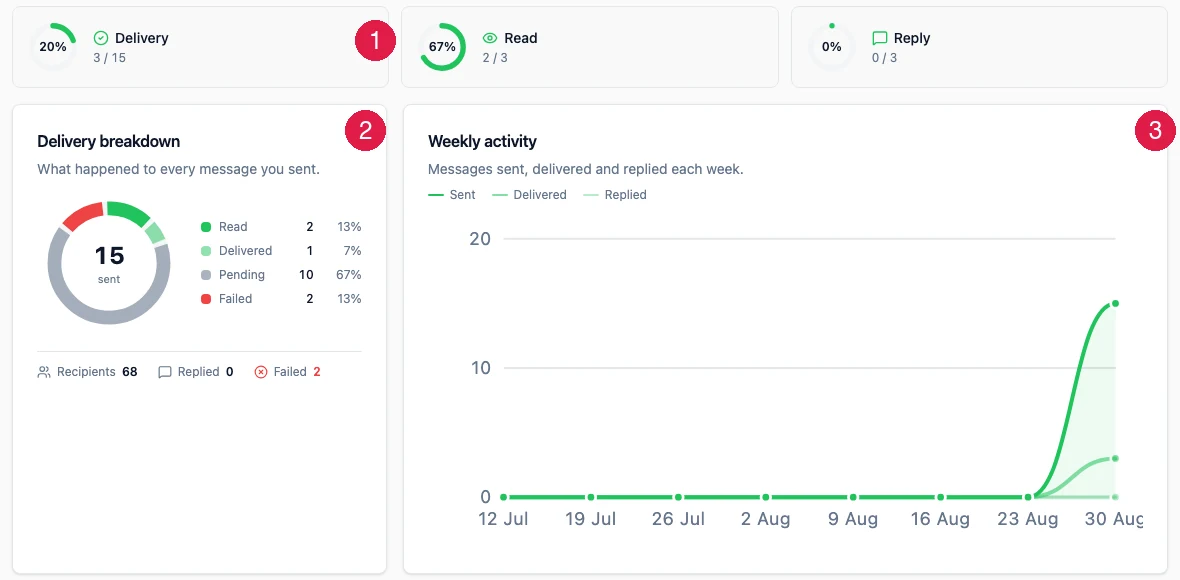
What the numbers mean
These stack up in order. Nobody can read a message that was never delivered, and nobody replies to
one they did not read. So when a number looks bad, always start from the top of the table and work
down.
Reading the results
Low delivered. The problem is the list, not the message. Wrong numbers, disconnected numbers, or people who blocked you. Clean up your customer records. Delivered fine but low read. The message arrived and nobody opened it. That is the first line of your template. WhatsApp shows a preview, so if the opening words are dull or look like an advert, people swipe past. Read fine but no replies. People saw it and did nothing. Either the offer is not interesting, or you did not tell them clearly what to do next. Add a button, or end with a plain question. Failed messages. Credits for a failed message are refunded automatically, so a failure costs you nothing except the chance. A few failures in a big campaign are normal. Many failures means a bad list or a number in trouble, and the health panel in Settings will usually say which.One campaign at a time
For a single campaign, open it from the Campaigns list, or choose View stats from its row menu. Its report shows the same five counters, the rates, where people dropped off, and a row for every recipient. See Campaigns.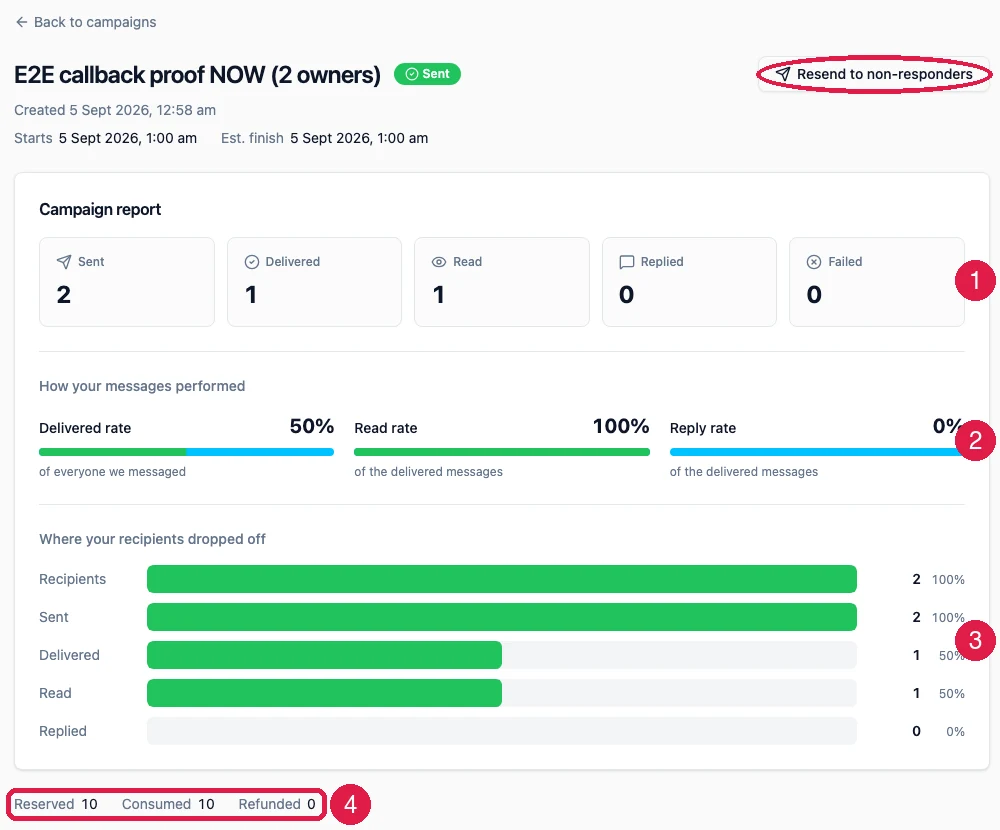
Related
Campaigns
Where the numbers come from.
Settings
Number health and quality rating.